Predicting the river level at Welsh Bridge, Shrewsbury using Machine Learning
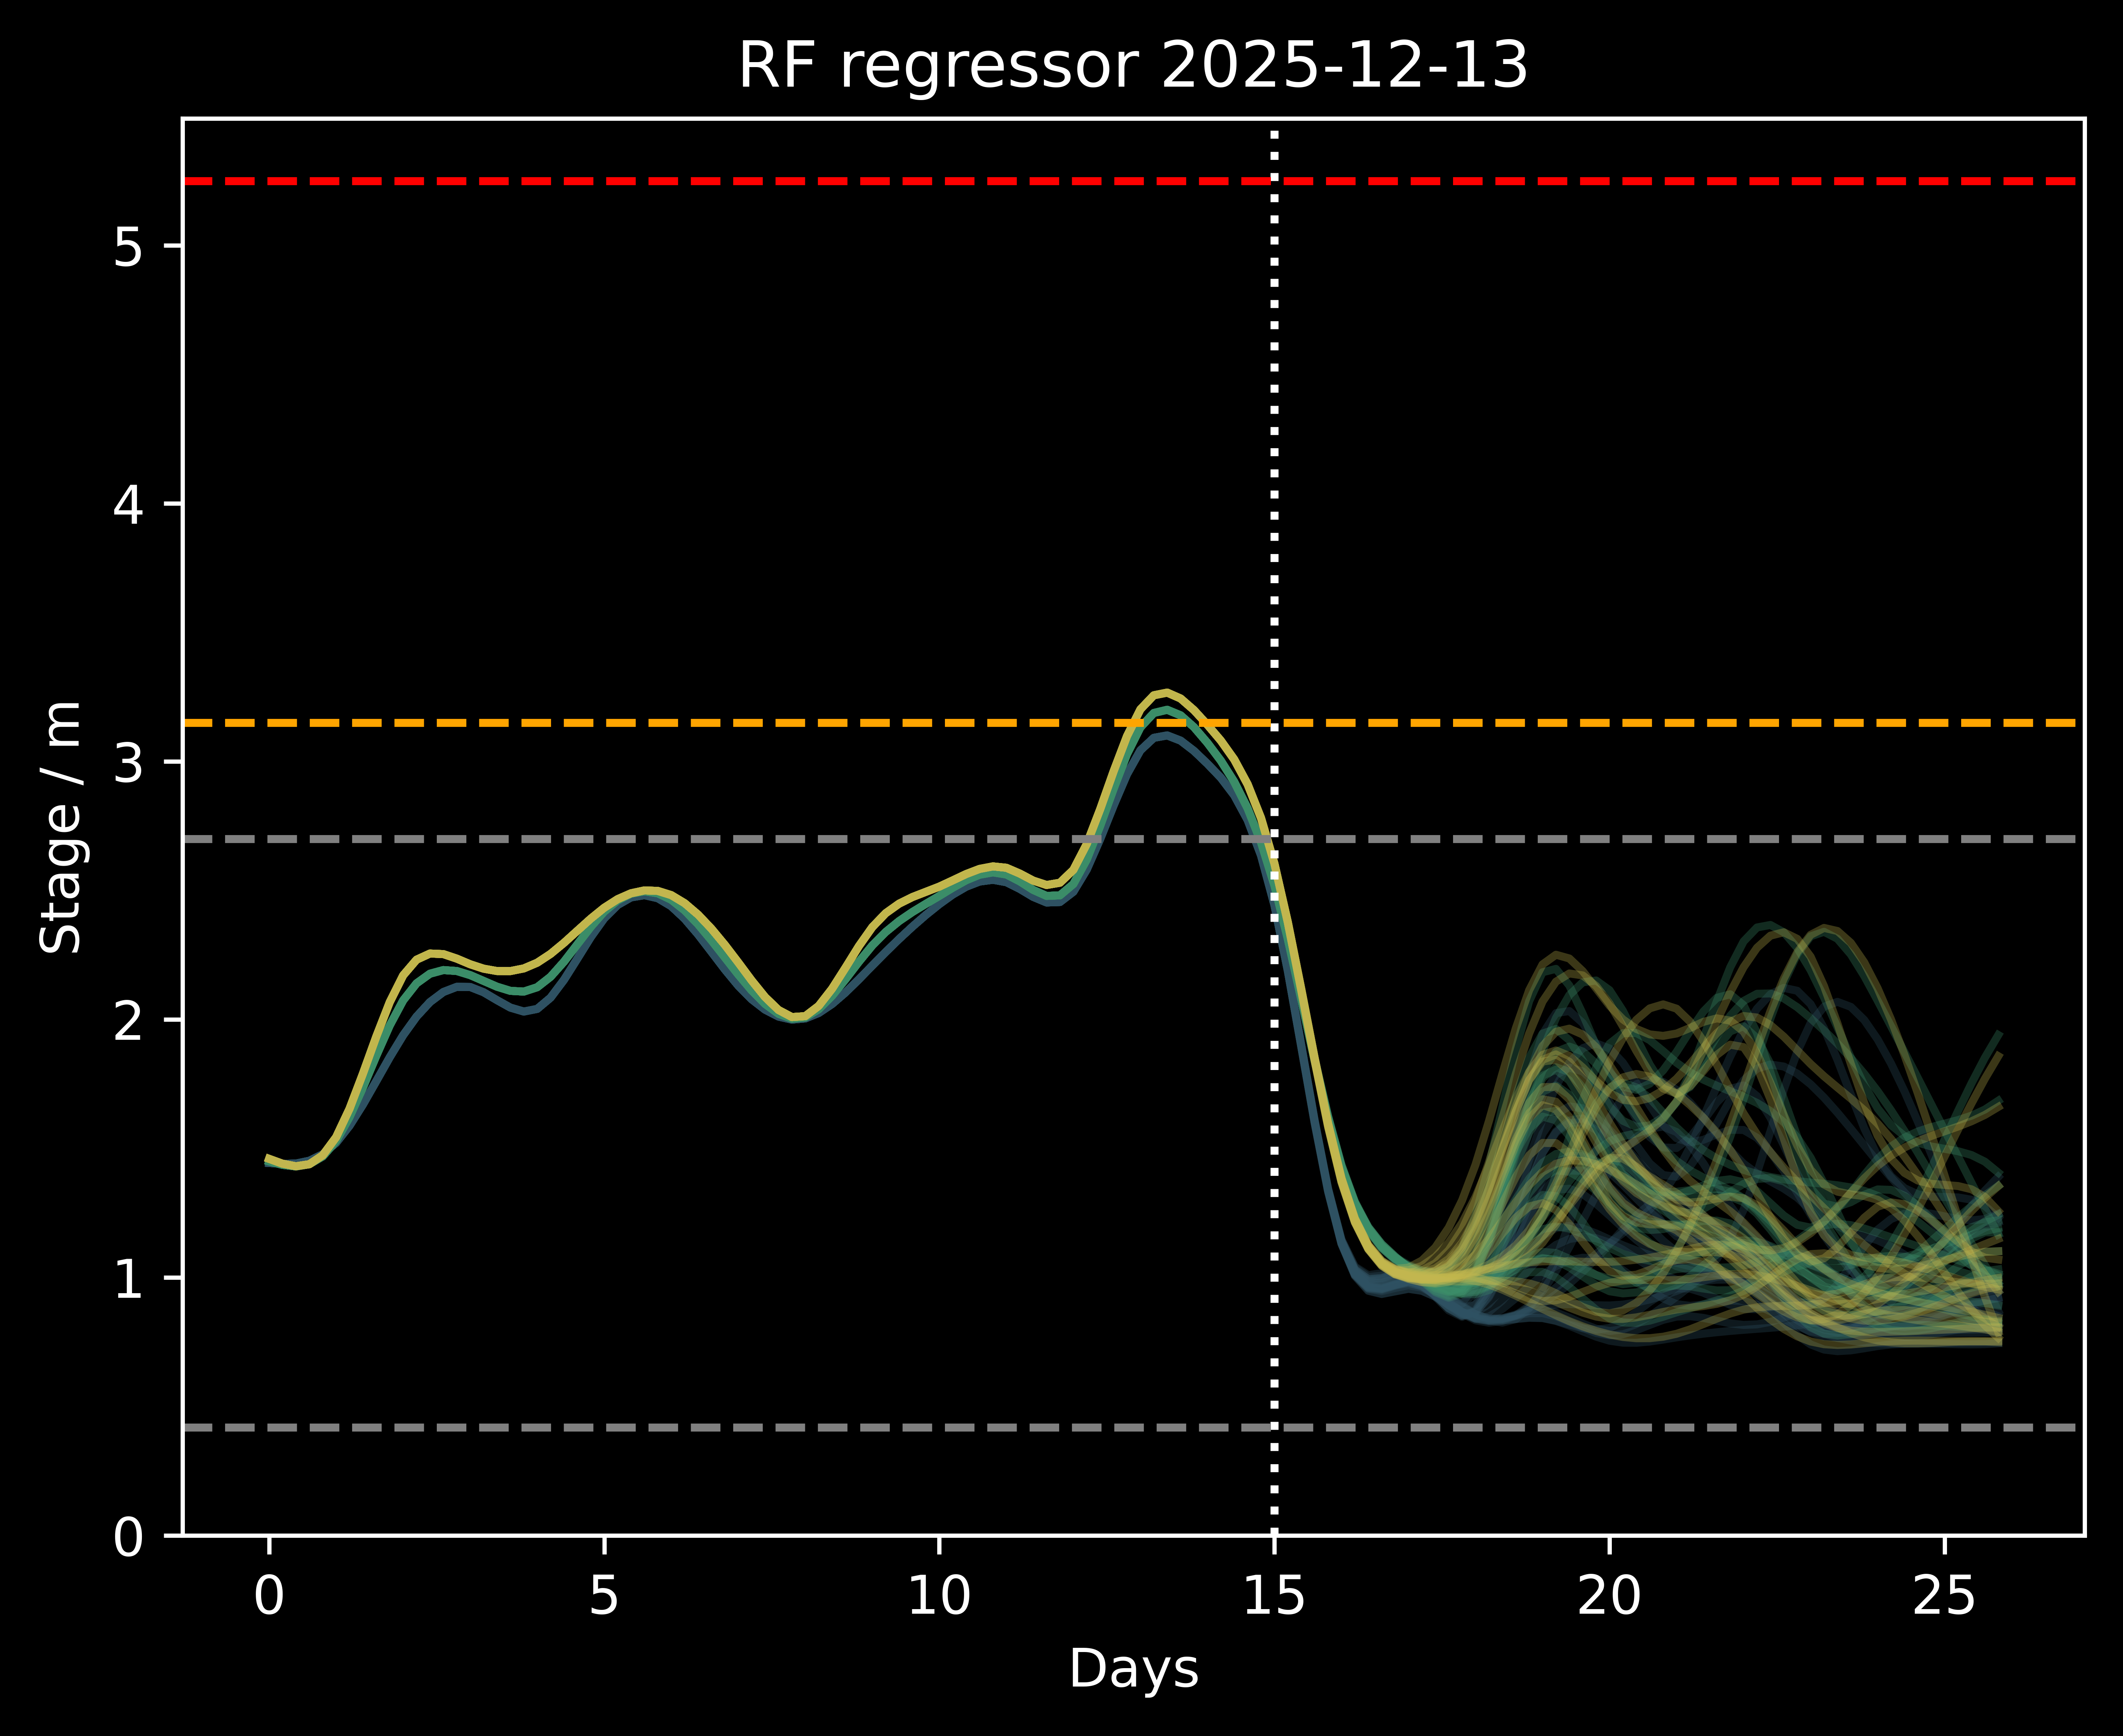
The dotted line indicates today with the values to the left being historical measurements
and the forecast prediction to the right of the line. The orange line is the threshold for
possible property flooding and the red line the record level. Predictions are run daily.
The graph above is for the predictions made by a Random Forest regressor. The model uses the Scikit-learn library.
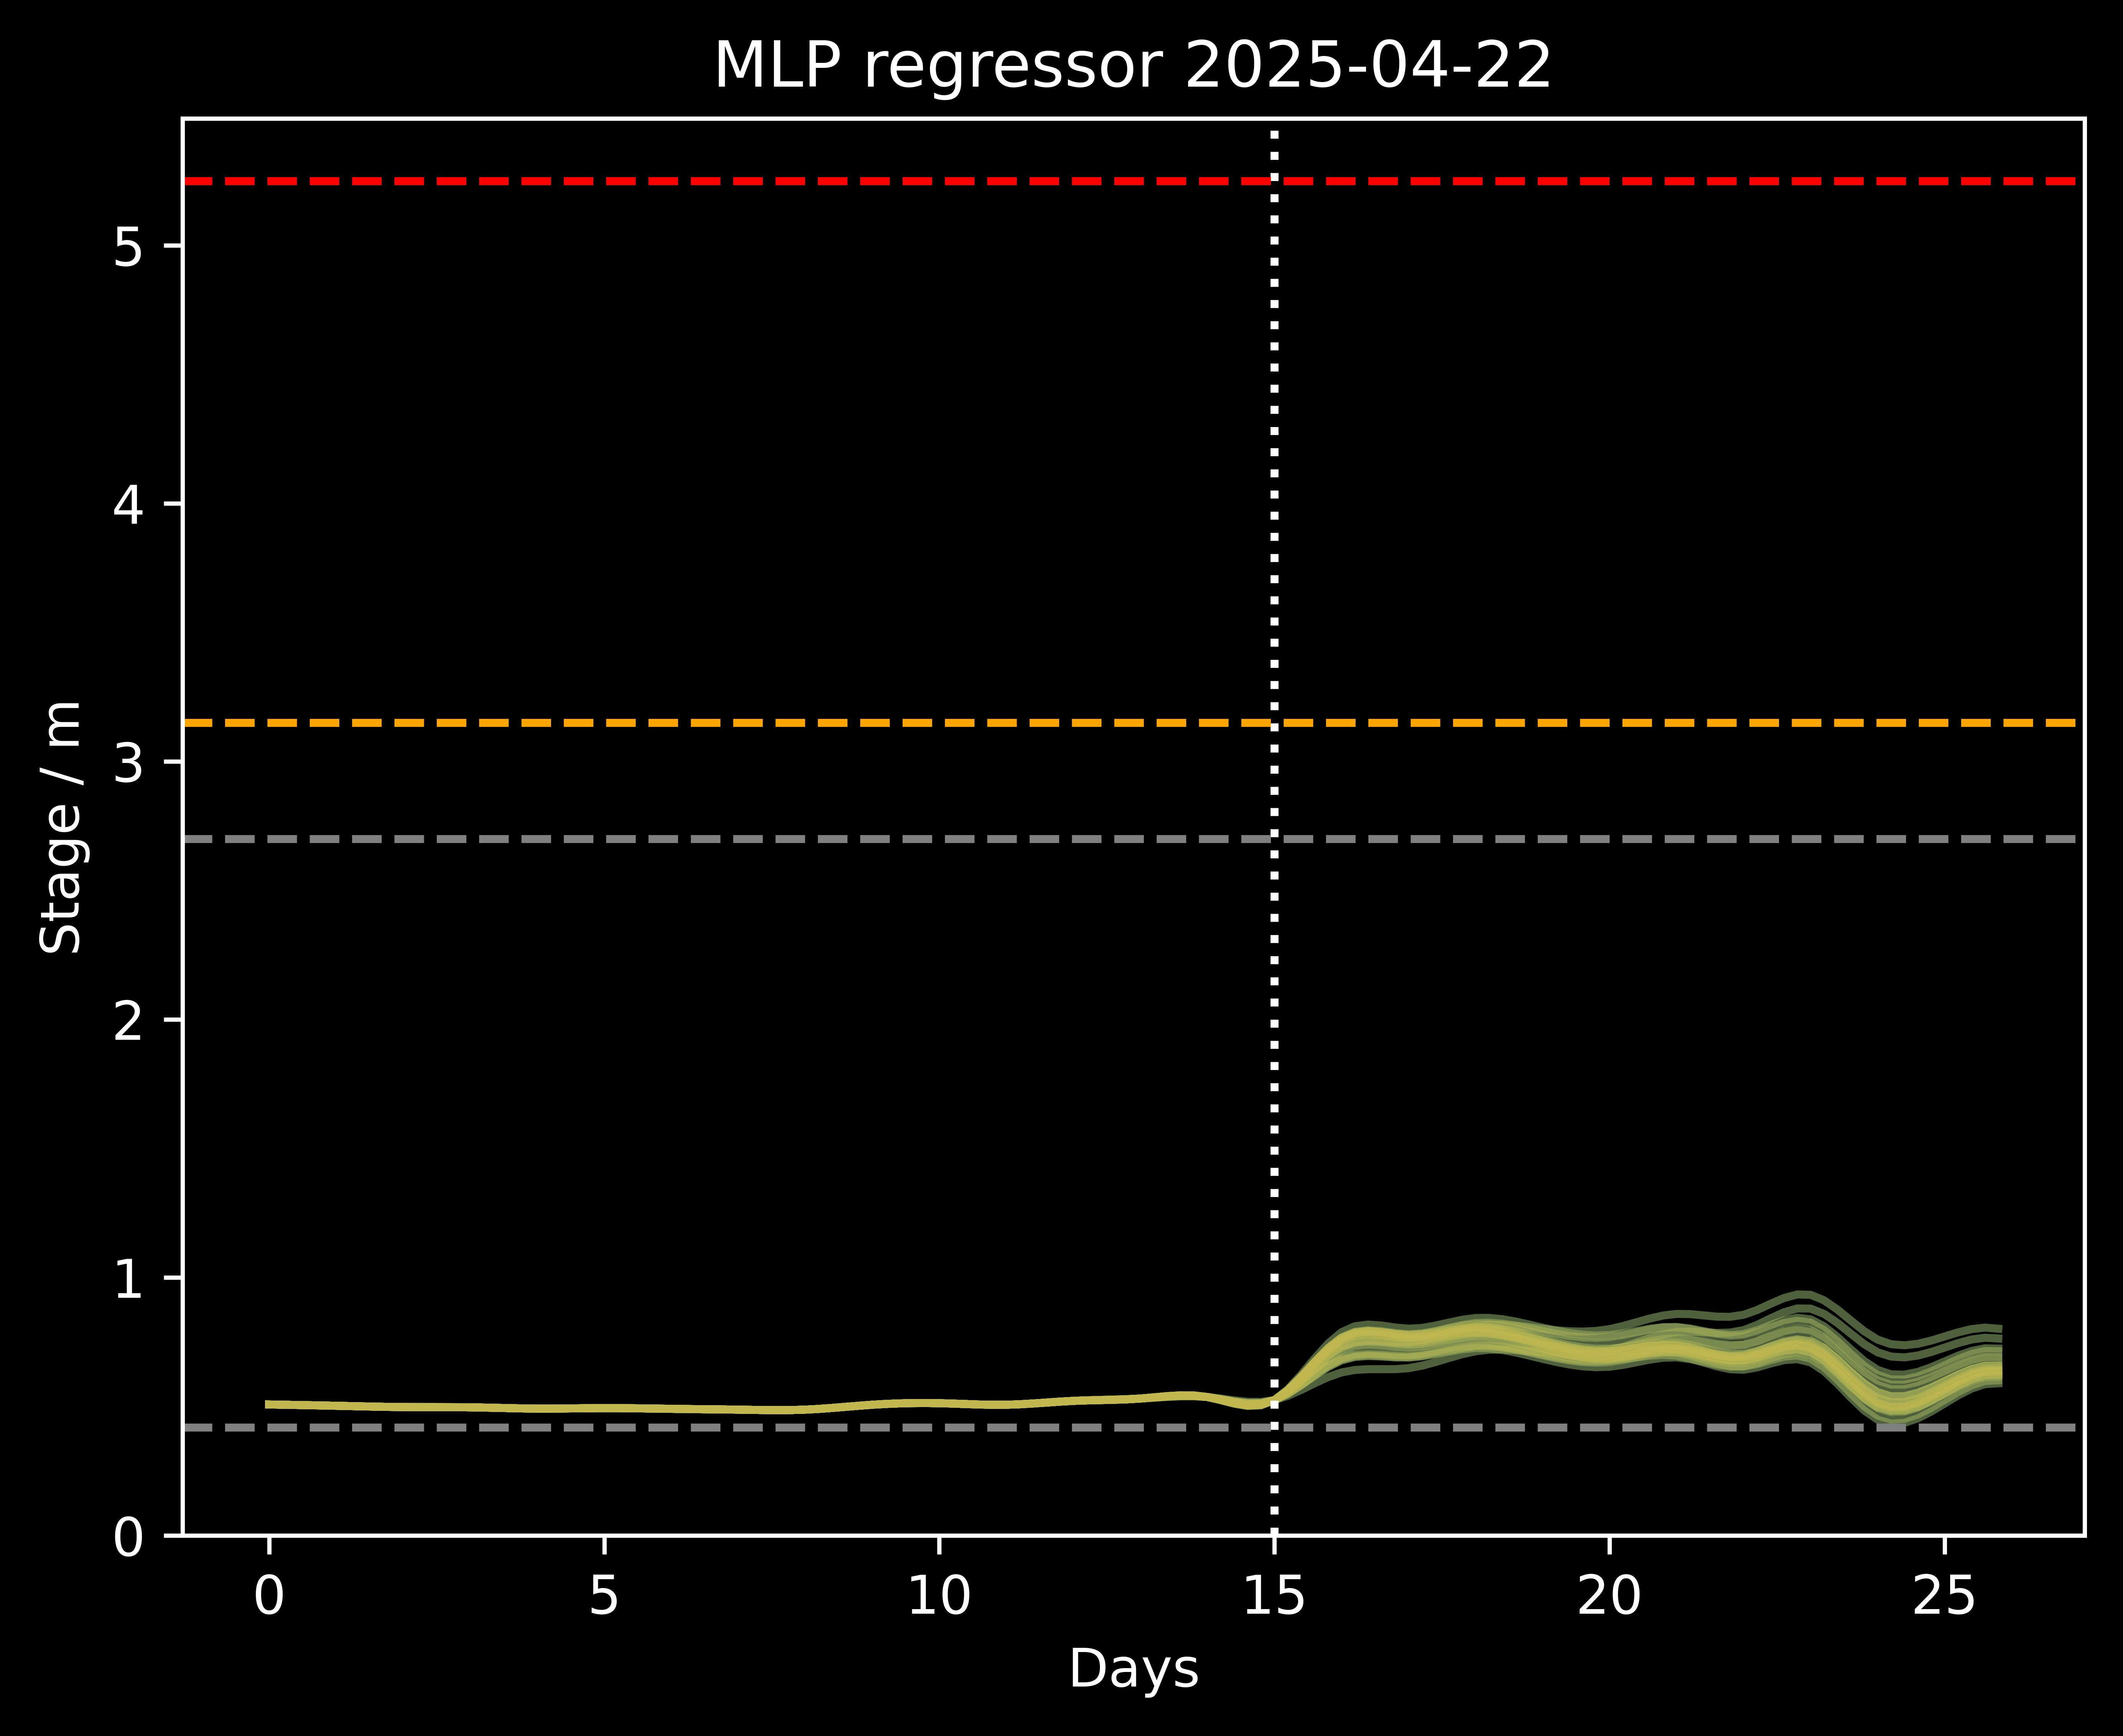
The graph above is for the predictions made by a self-coded Multi-layer Perceptron.
Real time data is congregated using multiple APIs in a Python and csv based data pipeline. The neural network is written in C# and includes mini-batch gradient descent, multi-threading and L2 regularisation/weight decay.
This is my first attempt at coding a deep learning model from scratch and there are many possible improvements. In addition to this, the very small dataset n ~ 1800 meant that optimisation and effective generalisation was certainly not optimal. The Random Forest algorithm maybe a better predictor (although it often produces a lot of false positives during the summer).
Key features of this Machine Learning project
this uses Environment Agency flood and river level data from the real-time data API (Beta)
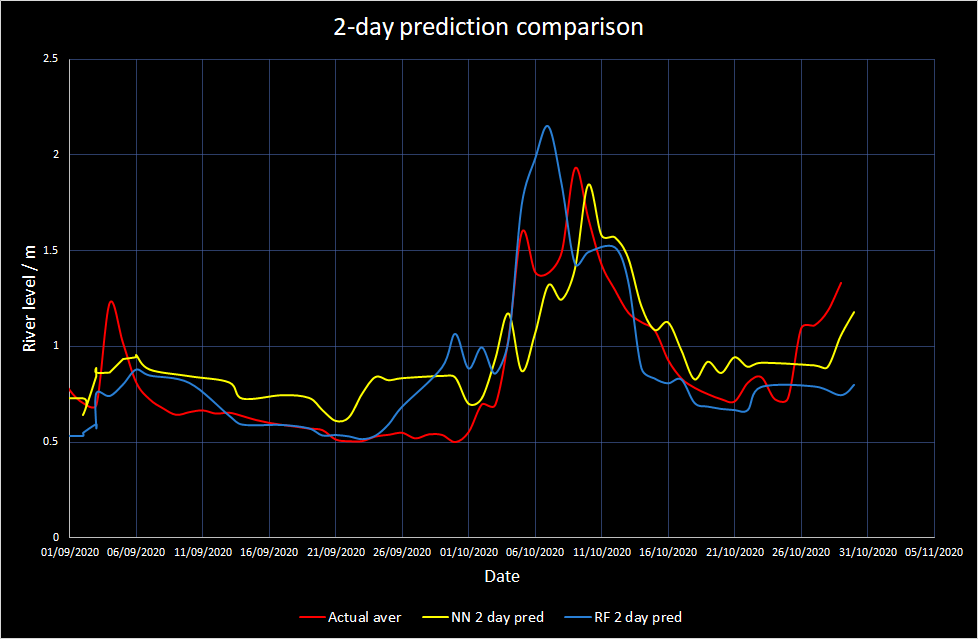
Focussing on the period from September to the end of October 2020.
High rainfall causes the river level to peak above the summer baseline. The following three graphs compare the predicted forecast (RF, NN) for 2, 5 and 10 days ahead versus the actual river level (red).
The first graph clearly shows that the forecast would have captured the peak rise two days in advance of when it occurs showing it is suitable for flood management preparation. Both forecast methods are within 20cm of the peak level. The 5-day graph also shows that the models were able to predict the rising level 5 days prior.
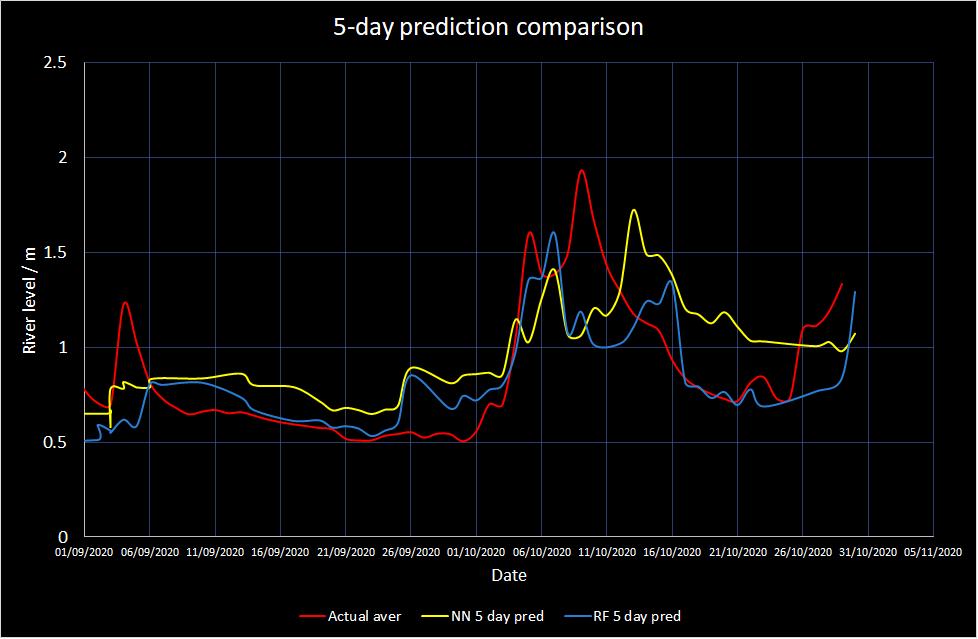
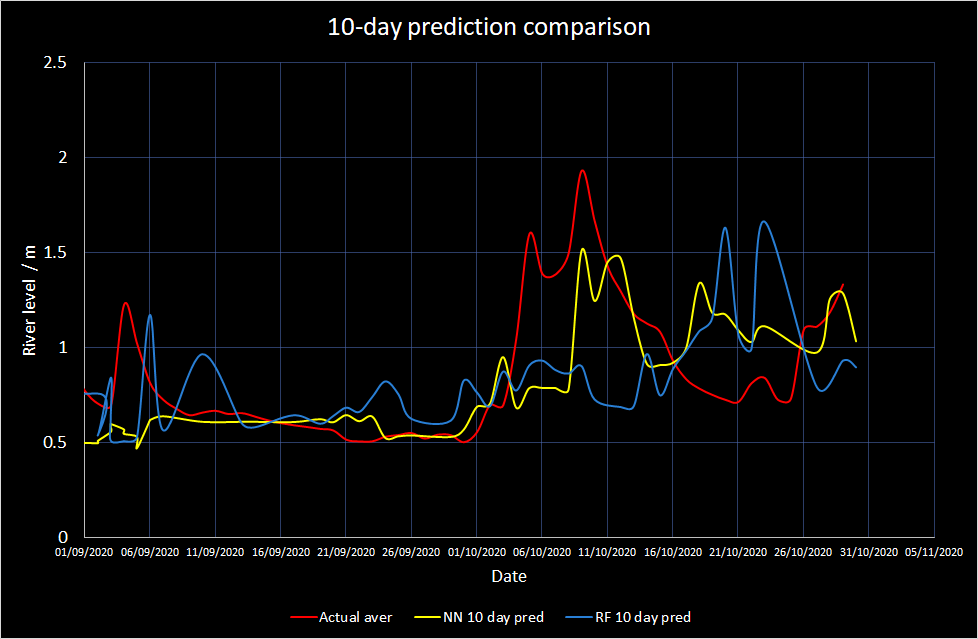
The 10-day prediction forecast had a poor predictability power. This could due to the uncertainty of
the rainfall forecast used which heavily influences river flow for longer term forecasts. There will also
be very limited benefit from the current river levels from the gauging stations upstream which don't
really influence 10 days in advance.
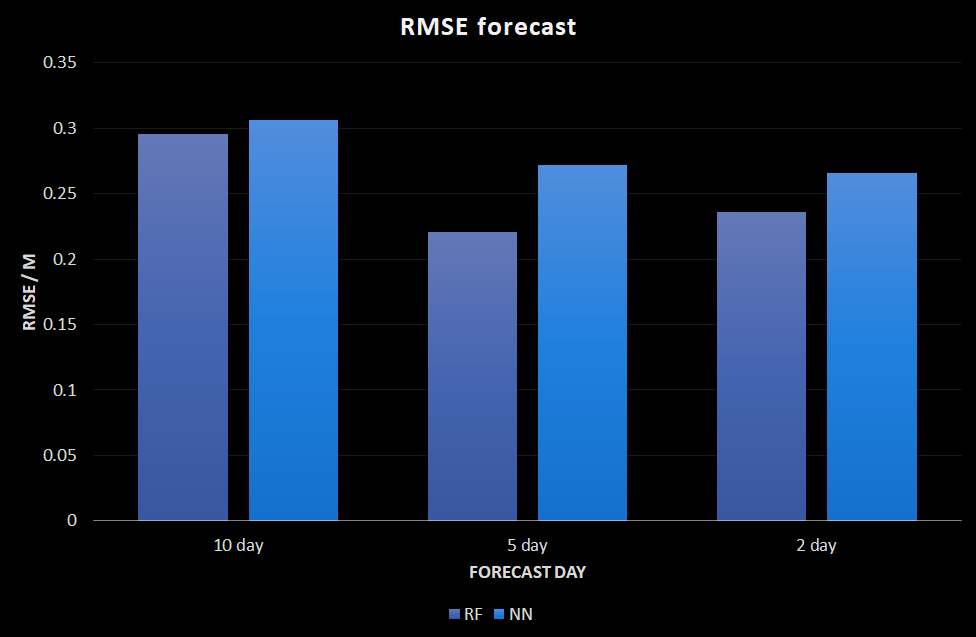
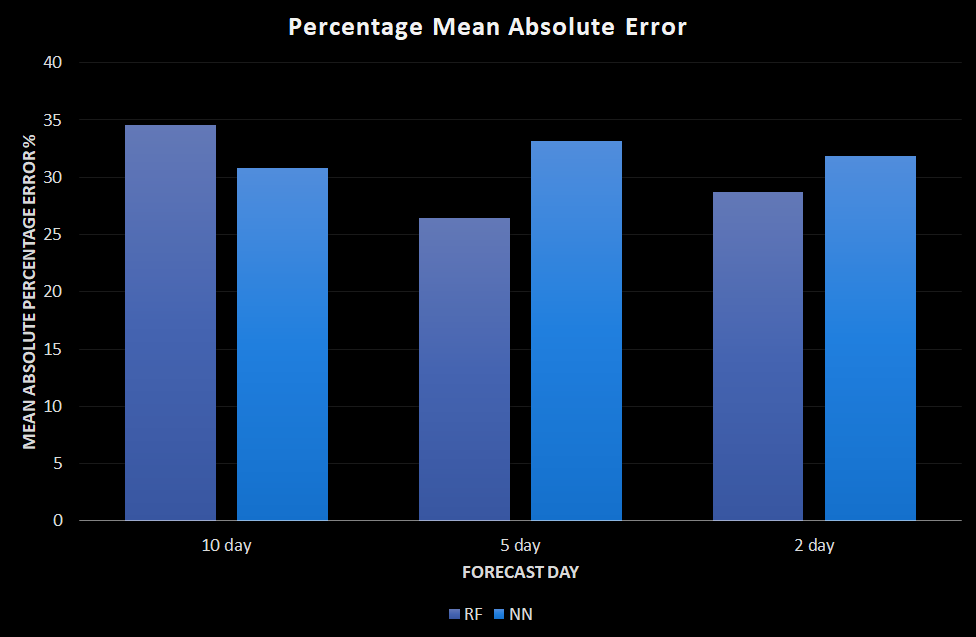
Analysis of prediction for April to October 2020. Neural network (NN) light blue/Random Forest (RF) purple. RMSE is the root of the mean squared error between the actual and predicted river level. The graphs show the error increase as the forecast day ahead increases (x-axis: 10-day, 5-day, 2-day). Random forest performs better than the Neural Network with an error (RMSE) of 22 cm at 5-days.
By Leo Ellis
created with
Website Builder Software .